- Acting films
- 12
- Acting avg
- 6.41
- Peak run
- 2011’13
Acting films, by TMDB rating
The career
Dot size shows audience votes. Films below the source vote floor sit on the baseline.
As an actor, films with 25+ votes
Peter by the numbers
Average
6.41
12 rated films
Vote weighted
6.47
bigger films count more
Median
6.5
half are better
Consistency
±0.63
rating spread
Career
21y
2002 to 2022
Total votes
10.4K
across every film
Best
7.3
Philomena
Worst
5.3
Swimfan
Newest first
Filmography
| 2025 |  My Mom Jayne | Self | 8.0 | 55 |
| 2022 |  Goodnight Mommy | Father | 6.3 | 589 |
| 2022 |  13: The Musical | Joel Goldman | 6.0 | 46 |
| 2013 |  Chinese Puzzle | John | 6.6 | 749 |
| 2013 | 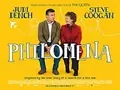 Philomena | Pete Olsson | 7.3 | 1,758 |
| 2013 |  All Is Bright | Tremblay | 5.4 | 140 |
| 2012 | 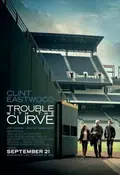 Trouble with the Curve | Greg | 7.0 | 1,744 |
| 2011 |  In the Family | Dave Robey | 6.7 | 42 |
| 2011 | 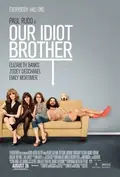 Our Idiot Brother | Terry | 6.1 | 1,074 |
| 2010 |  Just Wright | Dr. Taylor | 6.6 | 471 |
| 2010 |  Edge of Darkness | Sanderman | 6.5 | 1,822 |
| 2006 |  United 93 | Jeremy Glick | 7.1 | 1,708 |
| 2002 |  Swimfan | ER Doctor | 5.3 | 301 |
Takes